There are no items in your cart
Add More
Add More
| Item Details | Price | ||
|---|---|---|---|

Thu Apr 23, 2026
In the high-stakes world of equity research, specifically when you are grinding for the NISM Series XV: Research Analyst certification, there is one section of the balance sheet that acts as the ultimate truth serum for a company’s health:
Reserves and Surplus. If the Profit and Loss (P&L) statement is a high-speed video of a company’s performance over a year, the Reserves section is the permanent trophy room. It tells you exactly how much staying power a business has built up since its inception. In this exhaustive masterclass, we are going to deconstruct the concept of reserves, from the very first rupee of sales to how these numbers determine the future growth of a multi-billion-dollar enterprise.
As a Research Analyst, your job isn't just to look at Net Profit. Anyone with a basic app can see that. Your job is to gauge the Substantial Strength of a company. Is the company financially stable? Is it robust enough to survive a market downturn? Is it capable of self-funding its next massive expansion without begging banks for high-interest loans?
The answer to all these questions lies in Accumulated Profits, which we professionally term as Reserves. When we conduct Fundamental Analysis, we look at a company's Internal Accruals. If a company has been around for 10 years and its reserves have stayed flat, it tells a story of stagnation. But if those reserves are growing year-on-year (YoY), it’s a signal of a compounding machine.
Part 1: The Birth of a Reserve
To understand how a reserve is born, we must first look at the Revenue Statement (Profit and Loss Account). In the world of institutional research, we prefer the Vertical Format. Let’s follow the journey of a single rupee from the Top Line to the Bottom Line.
The Top Line: Sales Everything starts with Net Sales. This is the total value generated by the company’s core operations. In the analyst community, this is famously called the Top Line. If the top line is growing, the company is capturing market share.
At the Factory Level: COGS and Gross Profit From Sales. We first subtract the Cost of Goods Sold (COGS). These are your direct factory-level expenses: raw materials, labour, and direct manufacturing costs.
Next, we subtract the Operating Expenses. These are divided into three main buckets:
Analyst Tip: In tools like Screener, you will see the Operating Profit Margin (OPM). This is calculated as:A rising OPM indicates that the company is getting better at managing its daily business operations.OPM = (Operating Profit / Net Sales) x 100
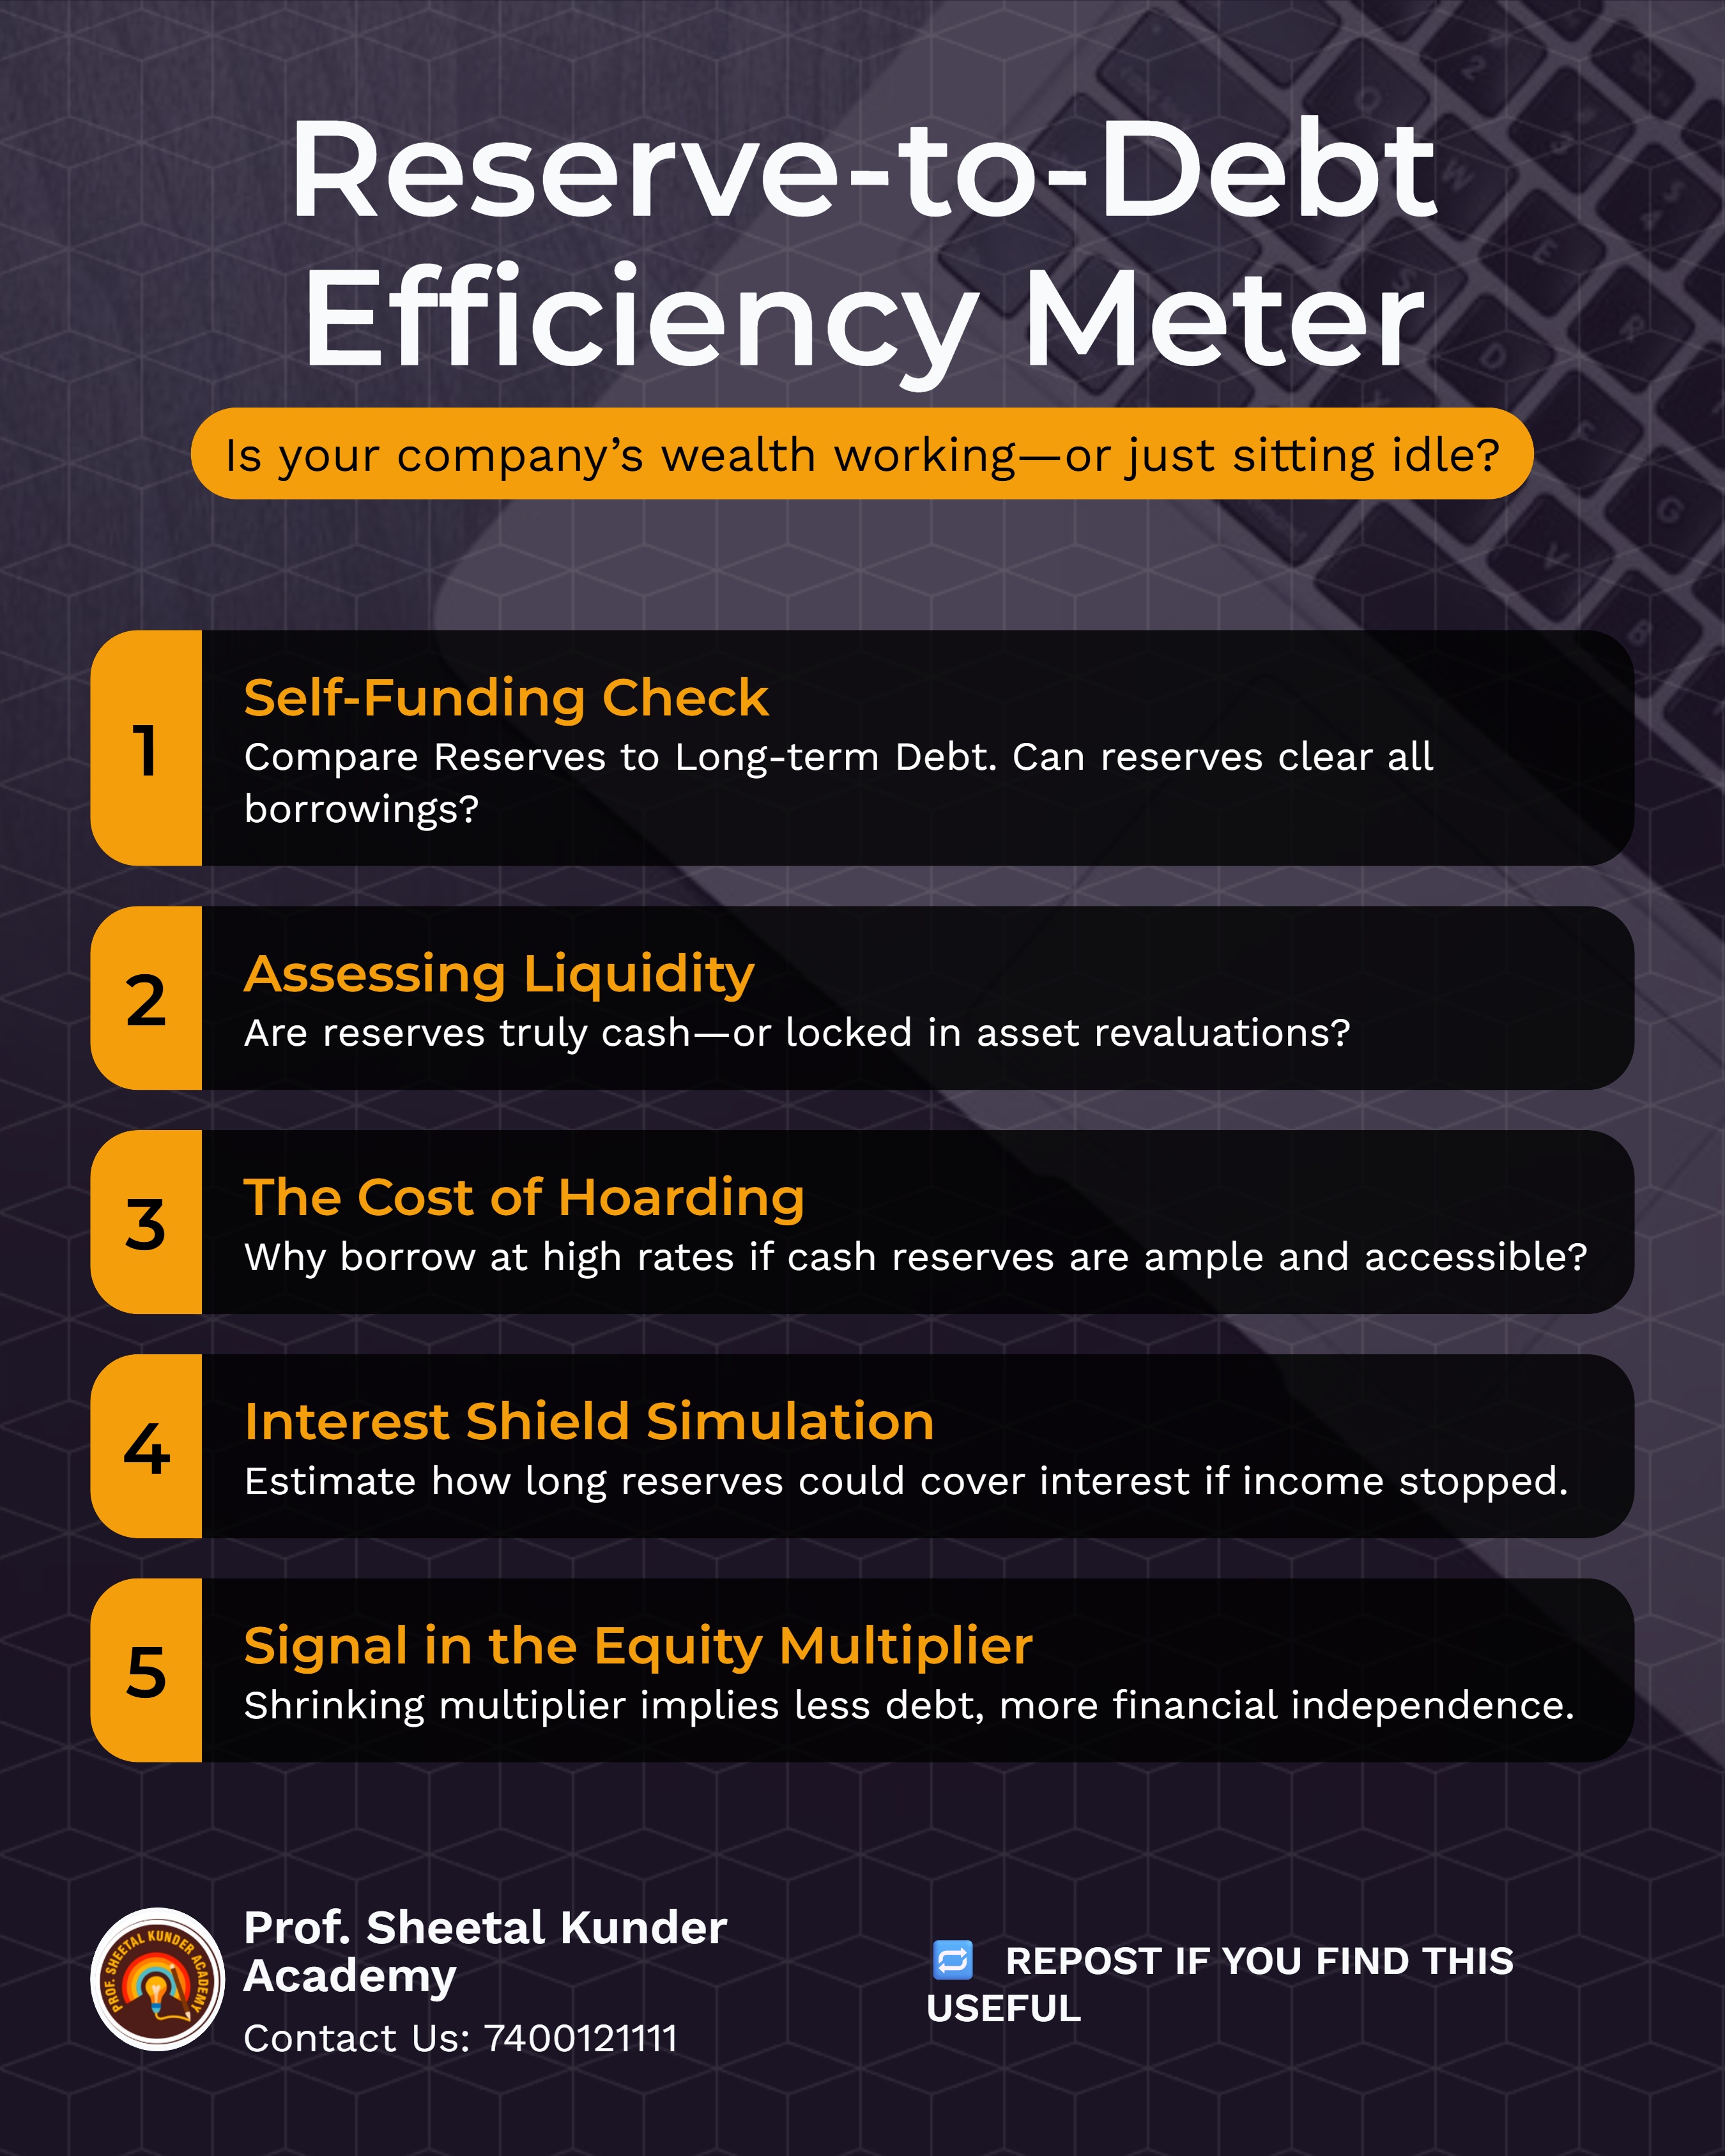
Companies often have idle cash invested in stocks, bonds, or land.
This is where the magic of Reserves and Surplus happens. Once the PAT is calculated, it belongs to the shareholders. However, they don't get all of it. The Board of Directors makes a strategic call. They split the PAT into two parts:
1. Dividends
This is the cash that goes directly into the shareholders' pockets. It is a reward for their investment.
2. Retained Earnings (The Seed for Reserves)
This is the profit the company keeps for itself. Why keep it?
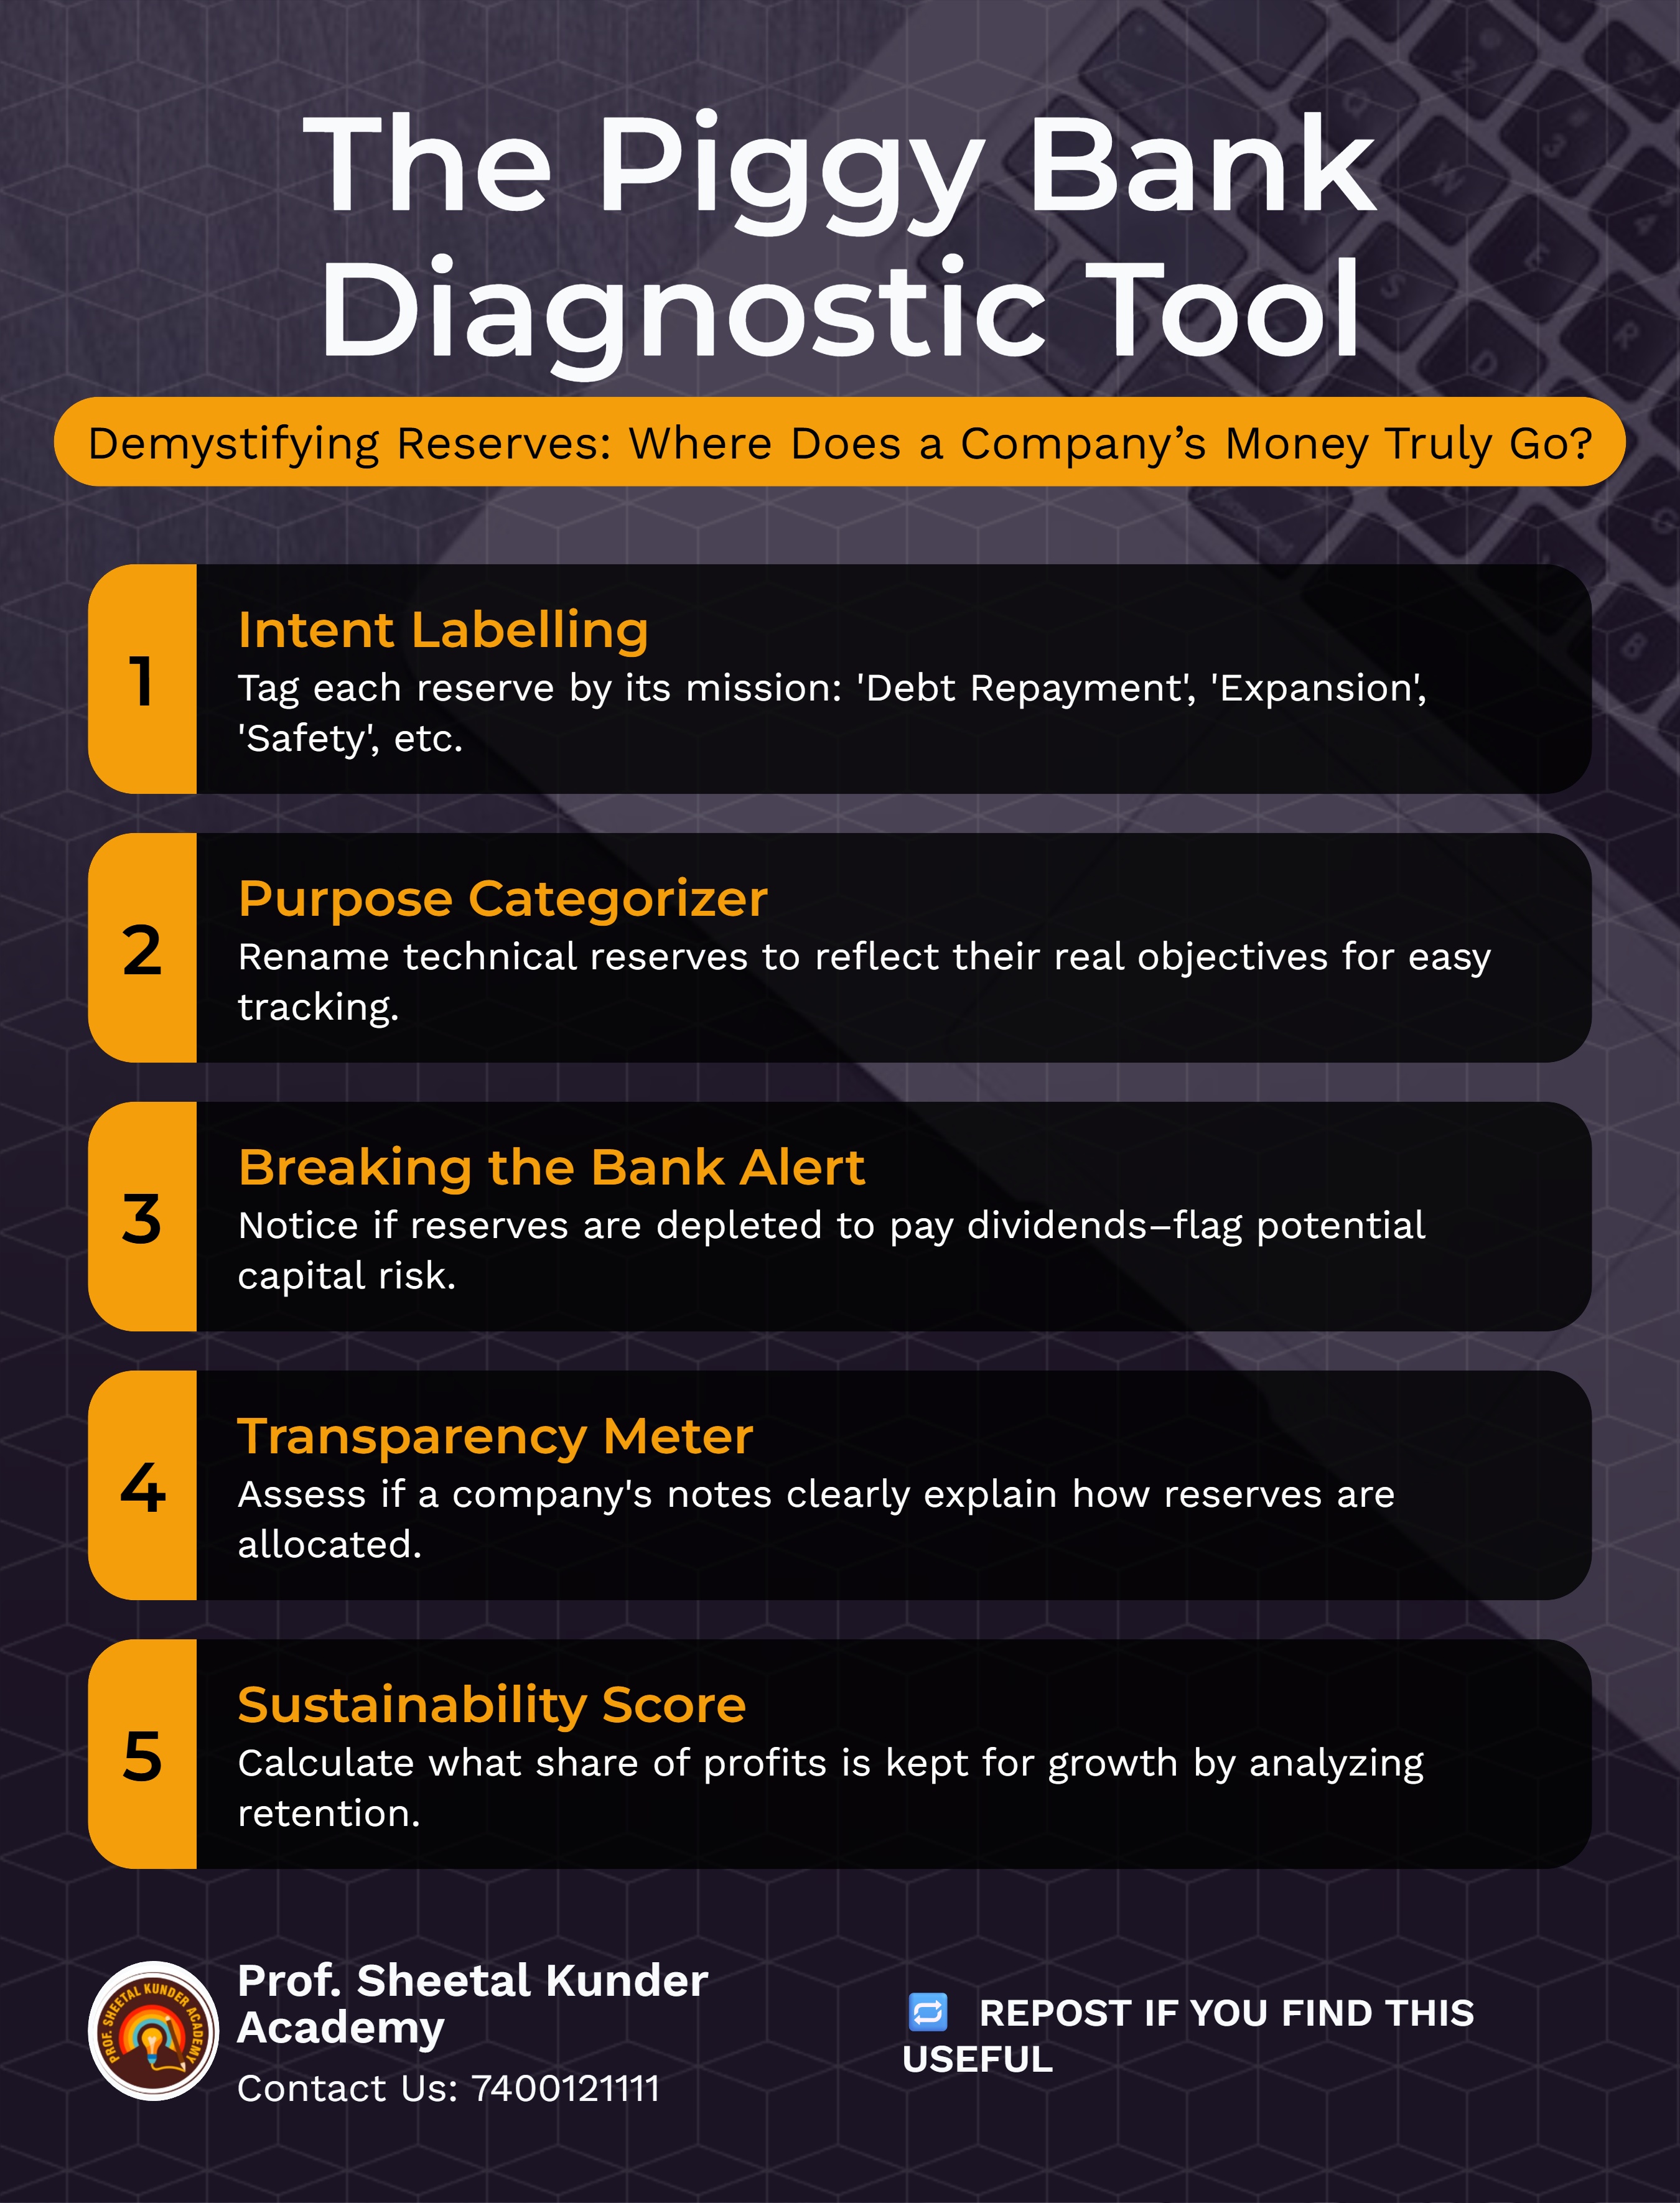
To explain reserves simply, think of the 2005 cult classic movie Mujhse Shaadi Karogi. Salman Khan’s character has three Gullaks (piggy banks) on his shelf. One is for his sister’s wedding, one is for his grandmother's operation, and one is for his own house. A company does the exact same thing with its profits. They allocate money to different "buckets" in the Balance Sheet.
These are generated from the core business profits.
These are mandated by law.
As the name suggests, these are not clearly shown on the balance sheet. They are often created by over-depreciating assets or undervaluing stocks. While less common in modern transparent accounting, they act as an invisible cushion for the company.
Now, how do you see this in real life? Let's take a look at the Shareholders' Equity section of a Balance Sheet.
If we look at the historical data of a giant like Reliance (as observed in recent screener data up to late 2025/early 2026):
While high reserves are good, a detective analyst looks for the following anomalies:
Clearing the NISM Series XV exam in 2026 requires you to move past the rote learning of definitions. You need to look at a company as a living, breathing entity.
Reserves and Surplus are the Savings Account of the corporate world. A strong savings account enables bold risks, extensive diversification, and ultimate stability. When you sit down to analyse your next stock, don't just look at the ticker price.
Open the balance sheet, find the Reserves line, and ask: How many piggy banks has this company filled, and what does it plan to do with them?

Prof. Sheetal Kunder
SEBI® Research Analyst. Registration No. INH000013800 M.Com, M.Phil, B.Ed, PGDFM, Teaching Diploma (in Accounting & Finance) from Cambridge International Examination, UK. Various NISM Certification Holders. Ex-BSE Institute Faculty. 18 years of extensive experience in Accounting & Finance. Faculty Development Programs and Management Development Programs at the PAN India level to create awareness about the emerging trends in the Indian Capital Market, and counsel hundreds of students in career choices in the finance area
 Launch your Graphy